3 SEA STATE PARAMETERS AND ENGINEERING WAVE SPECTRA
We recall that the sea state is the condition of the ocean surface considered as a stochastic field and characterised by the wave spectrum. This is the modern use of the word. Traditionally sea state is a scale for the average wave height somewhat similar to the Beaufort scale for wind.
The most complete wave spectra we are considering are the wavenumber spectrum ![]() , and the directional spectrum
, and the directional spectrum ![]() . As discussed in the previous section, practical wave analysis uses the frequency f instead of
. As discussed in the previous section, practical wave analysis uses the frequency f instead of ![]() . Moreover, engineers tend to use the directional spectrum instead of the wavenumber spectrum. Below we shall follow this convention and write the directional spectrum as
. Moreover, engineers tend to use the directional spectrum instead of the wavenumber spectrum. Below we shall follow this convention and write the directional spectrum as ![]() .
.
The square root of the variance of the surface, is the standard deviation of the surface. The standard deviation is a common measure for the variations about the mean and is thus a reasonable scale for the surface height variations. For historical reasons it has become a standard to denote four times the standard deviation the significant wave height. Significant wave height is written Hs, SWH, Hm0 or a number of other possibilities. We shall write Hm0 for a special reason. Related to the spectrum is a series of characteristic numbers called the spectral moments. These numbers, denoted ![]() are defined as
are defined as
![]()
The spectral moment ![]() is just the variance of the surface and hence
is just the variance of the surface and hence
![]()
which is the reason for the notation. The "old" definition of the significant wave height was the mean of the one third largest waves in the sea, - a definition which is not very easy to apply! The significant wave height is without doubt the most important sea state parameter. Note that when computed from actual wave measurements, the new definition is about 5% higher than the old definition.
The frequency for which ![]() attains its maximum is called the peak wave frequency.
attains its maximum is called the peak wave frequency.
![]() .
.
The inverse of ![]() is also used, and is called the peak period,
is also used, and is called the peak period,
![]() .
.
An equally common period parameter is the mean wave period, ![]() , also denoted
, also denoted ![]() :
:

We shall return to the most important directional wave parameters after we have discussed some engineering forms for the wave spectra. The wave spectrum for a given sea state may be measured by various wave recording devices and the functions we are going to present below have been found to fit the measurements.
The most well known functional form of S is the so-called Pierson-Moskowitz spectrum
![]() .
.
In the original work by Pierson and Moskowitz both Aand B were related to the wind speed 19.5 m (!) above the mean sea surface, but today A and B are in some way related to the main sea state parameters. One possibility is to set

Another popular form has been the JONSWAP spectrum which is defined by the somewhat curious expression
![]()
The JONSWAP spectrum is thus a Pierson-Moskowitz like spectrum multiplied by an extra "peak enhancement factor"
![]()
Verify that this factor is equal to g when ![]() and approaches 1 for large and small frequencies away from
and approaches 1 for large and small frequencies away from ![]() . JONSWAP was the acronym for a large field experiment in the North Sea in 1973. The measured spectra turned out not look like the Pierson-Moskowitz form and the extra, somewhat artificial factor was introduced in order better to fit the measurements.
. JONSWAP was the acronym for a large field experiment in the North Sea in 1973. The measured spectra turned out not look like the Pierson-Moskowitz form and the extra, somewhat artificial factor was introduced in order better to fit the measurements.
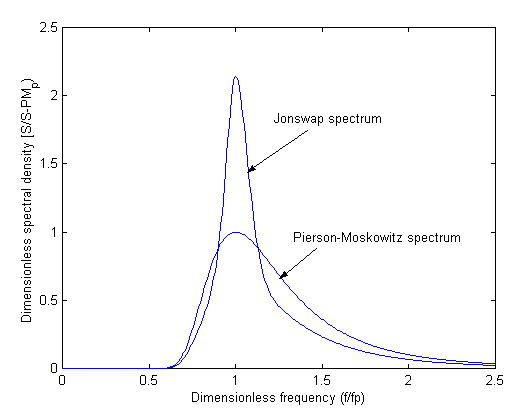
Fig. 3.1: The Pierson-Moskowitz spectrum and the standard JONSWAP spectrum.
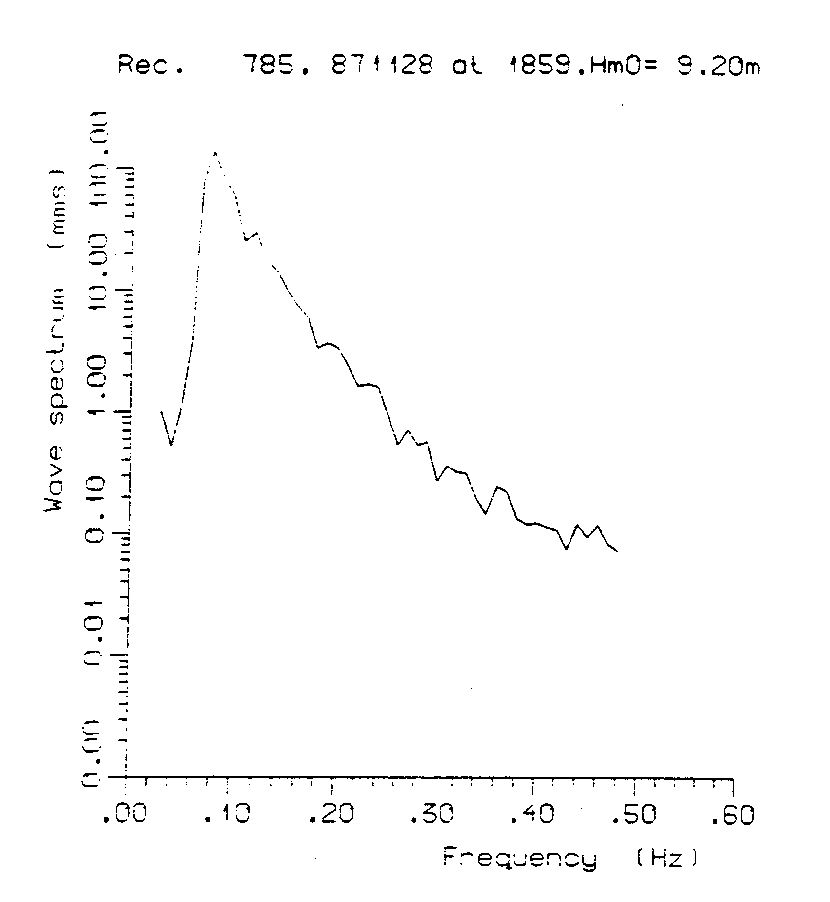
Fig.3.2: Example of a measured frequency spectrum for a heavy sea state. Note the use of a logarithmic vertical axis
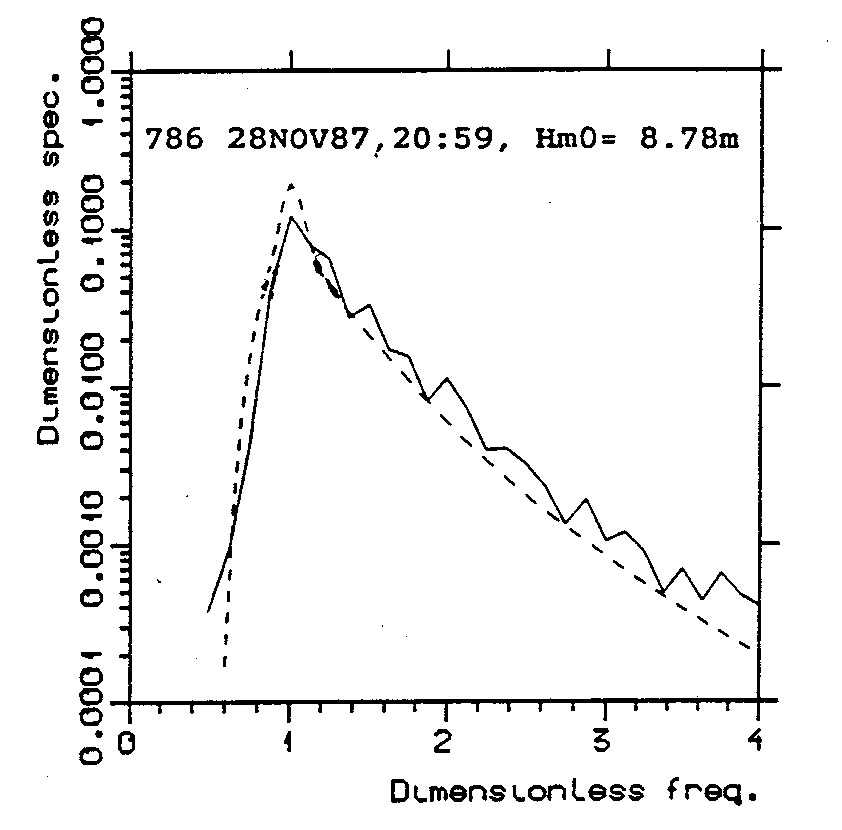
Fig. 3.3 : Non-dimensional measured spectrum compared to the JONSWAP spectrum.
In many practical situations, the directions of the waves are also of great interest and the directional part of the spectrum is now just at the point of being included in engineering analyses. We recall the directional spectrum as
![]() .
.
The directional distribution, ![]() , may be understood as the distribution of wave energy for a given frequency
, may be understood as the distribution of wave energy for a given frequency ![]() over the directions
over the directions ![]() . Note that D is generally also a function of
. Note that D is generally also a function of ![]() . This reflects the fact that there most of the time exists several systems of waves simultaneously. High frequency wind sea and low frequency swell from different direction is a common case.
. This reflects the fact that there most of the time exists several systems of waves simultaneously. High frequency wind sea and low frequency swell from different direction is a common case.
Since ![]() is a periodic function of
is a periodic function of ![]() it is convenient to introduce the Fourier series
it is convenient to introduce the Fourier series
![]() .
.
Note that this expression already fulfils already
![]()
It turns out that many of the common instruments that measure directional wave spectra actually measure Fourier coefficients (as a function of the frequency) rather than the directional distribution itself.
The facts that ![]() and has integral equal to 1 suggests that we may think of D as a kind of probability distribution over direction. We recall that the most important parameters for a probability distribution are the mean and the standard deviation. Usually, the stochastic variables we meet are taking integer or real numbers as values, but in the present case, where
and has integral equal to 1 suggests that we may think of D as a kind of probability distribution over direction. We recall that the most important parameters for a probability distribution are the mean and the standard deviation. Usually, the stochastic variables we meet are taking integer or real numbers as values, but in the present case, where ![]() the definitions of the mean and the standard deviations have to be modified. It turns out that the most common definitions, which in the present case are denoted the mean direction and the directional spread for D are defined directly in terms of the Fourier coefficients. The mean direction is defined as
the definitions of the mean and the standard deviations have to be modified. It turns out that the most common definitions, which in the present case are denoted the mean direction and the directional spread for D are defined directly in terms of the Fourier coefficients. The mean direction is defined as
![]() ,
,
that is, the direction of the vector with components ![]() , or the direction (argument) of the complex number
, or the direction (argument) of the complex number
![]() .
.
Note that this also implies that ![]() and
and ![]() .
.
For the directional spread (or rather the directional variance) we would like to have an expression
![]()
which, however, is not periodic. One possible choice is instead to use ![]() which is approximately equal to
which is approximately equal to ![]() when
when ![]() small. This gives us
small. This gives us

which is usually written as ![]() (suppressing the dependence of frequency). In summary, both the mean direction and the directional spread may thus be derived from the first pair of Fourier coefficients.
(suppressing the dependence of frequency). In summary, both the mean direction and the directional spread may thus be derived from the first pair of Fourier coefficients.
When it comes to actually describing the directional distributions, several functional forms are in use. An often used form is the cos-2s-distribution
![]()
where ![]() and
and ![]() is a normalisation factor such that the integral becomes equal to 1 (s is an integer). It is possible to show that
is a normalisation factor such that the integral becomes equal to 1 (s is an integer). It is possible to show that ![]() where
where ![]() denotes the Gamma function.
denotes the Gamma function.
![]()
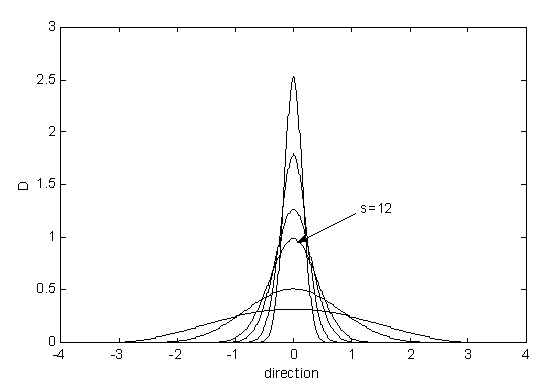
Fig. 3.4 : The cos-2s-distribution for several values of s. s = 1, 3, 12, 20, 40, 80. s = 12 is commonly used as an estimate for practical purposes.
Examples of directional spectra follows:
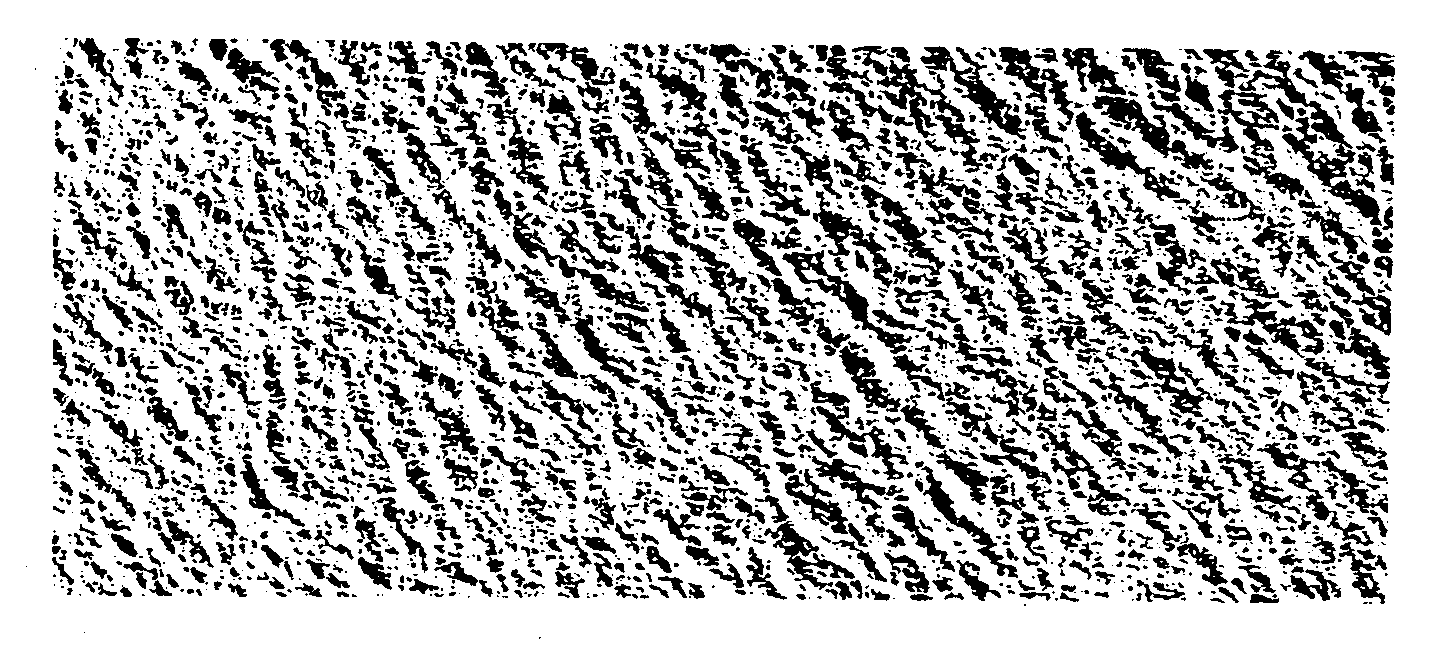
Aerial image of a surface gravity wave field
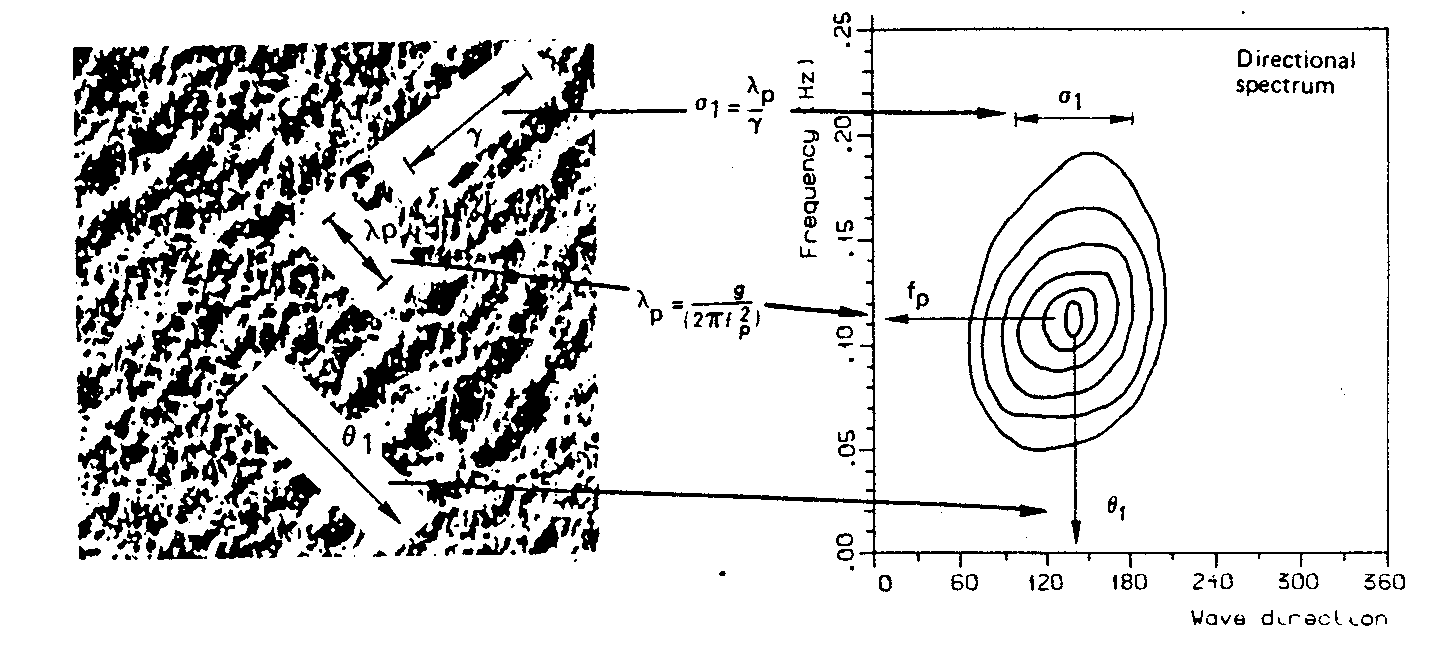
Dominant wave length (lp), crest length (g) and direction (q1) and their spectral counterparts.
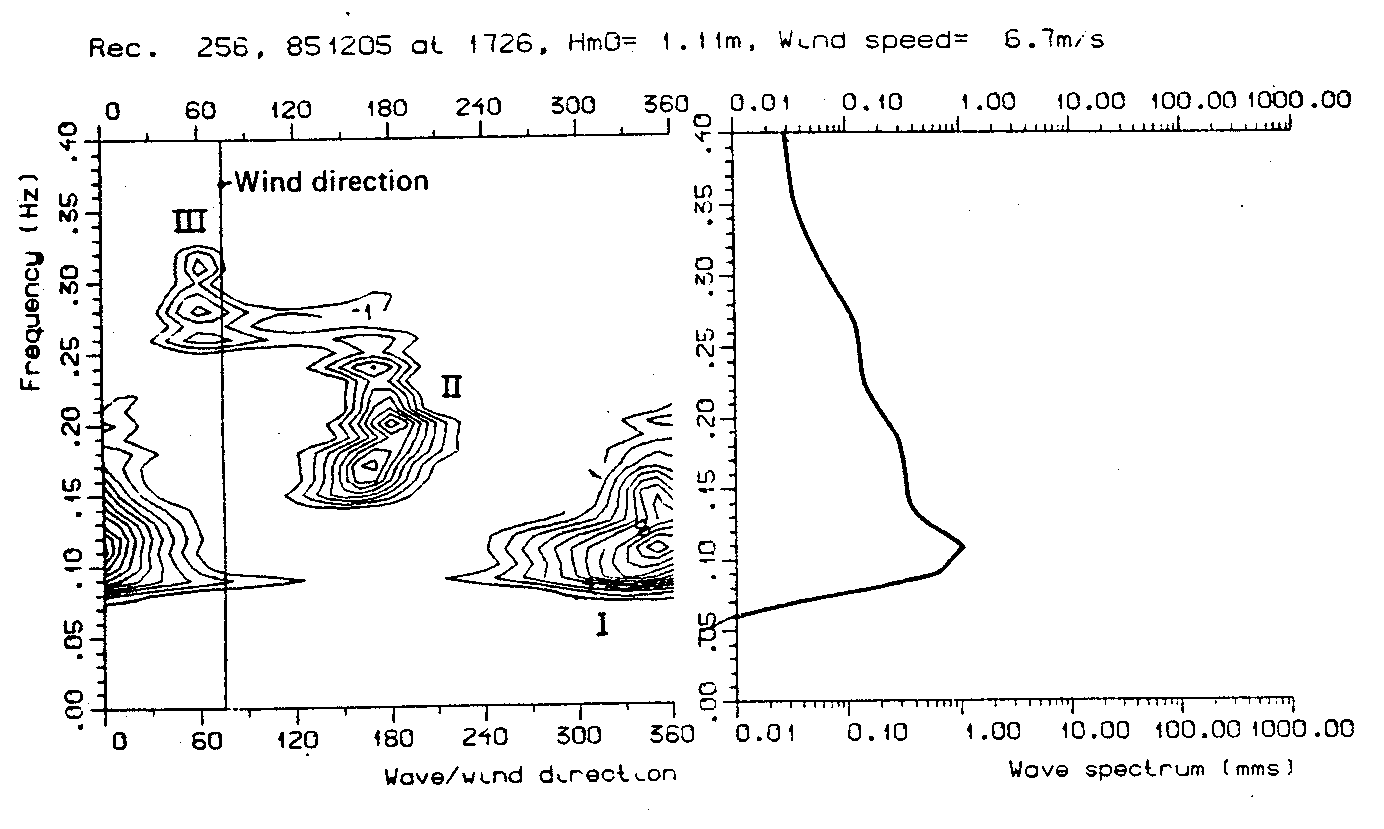
Contour plot of a real sea state showing the mixture of waves coming from thre
different directions. I: swell from north, II: 'svell' from south and III: wind
waves from east-north-east.
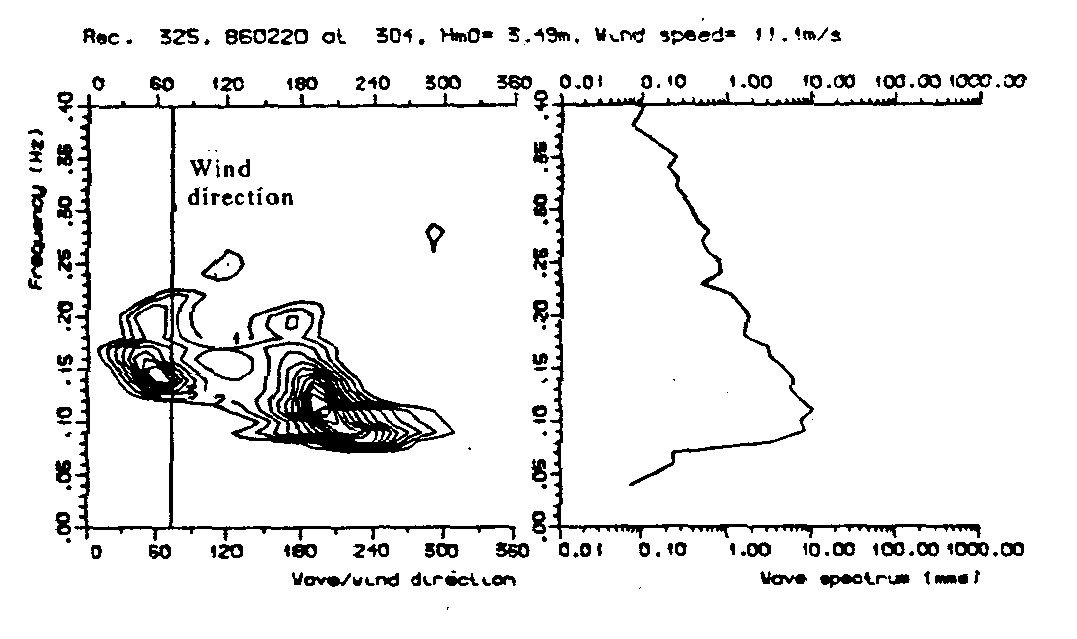
Contour plots ofa real sea state with wind waves from east-north-east and 'swell'
from south.